

It can be difficult to gauge what’s happening locally and how your restaurant compares to others. Keeping a pulse on all that’s happening in the industry and in your neighbourhood also takes a lot of time that’s hard to find.
And while there are no shortcuts when it comes to taking the local pulse, there are ways to see how you stack up against other local spots in the area. Restaurants can make more confident decisions if armed with the right information.
We pulled together data and insights on market-level reservations and diner sentiments about eating out and neighbourhood-level reservations. It’s all part of OpenTable’s benchmark reporting.
Here’s what you need to know.
Understanding diner demand
To help you understand more about diner demand and create a game plan for your own reopening, we connect with diners directly. Through channels like our quarterly Diner Insights, we get the rub on what guests are feeling toward eating out – that’s to say, what they want from a restaurant experience.
These surveys provide the thoughts of dinners, and their regularity means we keep up to date on the latest trends in the industry.
Since dining and reservations can vary drastically from one market to the next, specific and local data and insights are even more valuable. For example, are slower Tuesday nights typical in your neighbourhood, or is your restaurant specifically seeing fewer covers?
Benchmark reporting
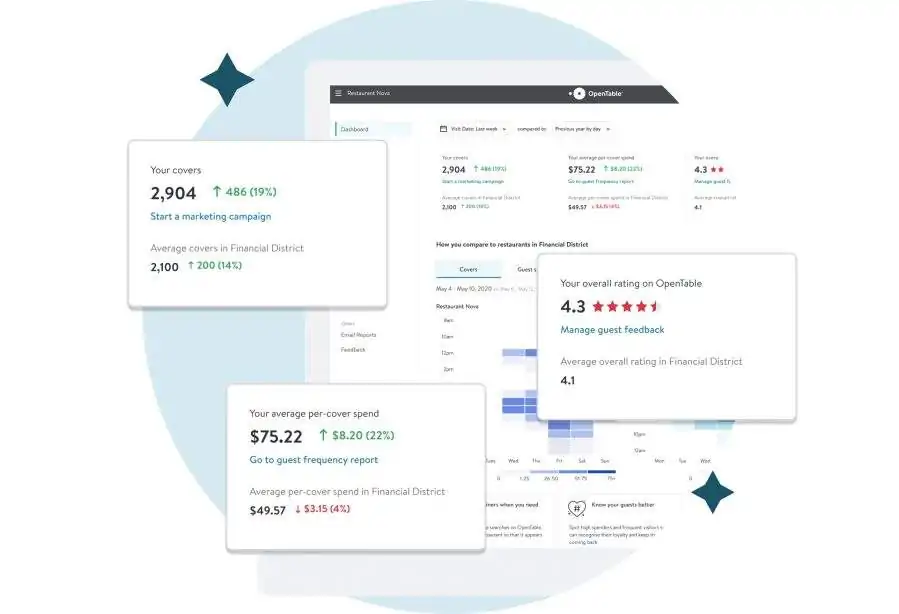
OpenTable restaurants can tap into benchmark reporting to get an overview and compare with other local OpenTable restaurants in their community to see what’s really going on.
With a global base of thousands of restaurants, OpenTable is uniquely positioned to provide anonymized and aggregated information on cover, spend, and feedback data from local restaurants to provide insight about your neighbourhood.
Keep pace with the local marketplace
Benchmark reporting allows restaurant owners to compare their seated diner activity, spending and reviews to a minimum anonymous group of 25 other nearby OpenTable restaurants.
The goal is simple: help restaurants pulse-check their performance versus neighbourhood leaders. These insights can lead to better decisions that maximize revenue and repeat visits.
Key features:
- Local comparison: Easily see how your metrics stack up in the local market
- Comprehensive metrics: Guest seats, spending and reviews
- Guest network access: Connect to OpenTable’s extensive diner network
- Strategic decision making: Spotlight successes and gaps informs better strategies
- Anonymity: Individual restaurants remain anonymous
- Actionable: Suggests measurable steps – marketing campaigns, review management etc
- Market insights: Uncover peak times, spending trends and no-show likelihoods
It’s never been easier to uncover gaps and successes in performance, then quickly navigate to OpenTable tools to take actions for improvement, with the assurance that your own restaurant’s performance and participation is also anonymous.
The bottom line? Benchmark reporting offers restaurants tangible benefits, whether it’s strategic planning to help inform decisions on the local landscape or pinpointing areas that need improvement.
Driving success
It’s never been easier to uncover gaps and successes in performance, then quickly navigate to OpenTable tools to take actions for improvement, with the assurance that your own restaurant’s performance and participation is also anonymous.
Benchmark reporting is available across all OpenTable plans. Learn more about how it can help your business.
Already an OpenTable customer? Access your benchmark reporting overview in OpenTable here.